四种经典机器学习算法测试——Bayes, SVM, 决策树, K-Means

给定数据集“Sort_1000pics”,该数据集包含1000张彩色图片,分为10类。使用Bayes,SVM,决策树,K-Means四种算法对该数据集进行分类,输出各算法的混淆矩阵,准确率,时间效率等测试结果。
1 数据集
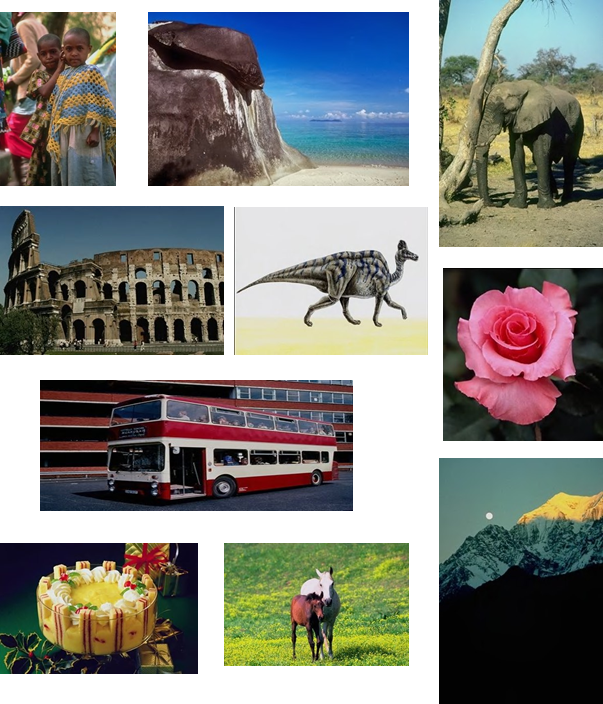
Sort_1000pics数据集由1000图片组成,分为人、沙滩、建筑、卡车、恐龙、大象、花朵、马、山峰、食物10大类。
2 实验方案
2.1 生成数据与标签
import cv2
import numpy as np
class DataLoader(object):
def __init__(self, path, label, relabel='false'):
self.path = path
self.label = label
if relabel:
self.label = [0,1,2,3,4,5,6,7,8,9]
def data(self):
x = []
y = []
for i in range(0,10):
for f in range(0,100):
l = str(100*i+f)
# 读取图片数据
images = cv2.imread("{}/{}.jpg".format(self.path,l))
# 统一shape
# image = cv2.resize(images, (256,256), interpolation=cv2.INTER_CUBIC)
# 灰度直方图
# hist = cv2.calcHist([images], [0, 1, 2], None, [256,256,256], [0.0, 256.0, 0.0, 256.0, 0.0, 256.0])
hist = cv2.calcHist([images], [0, 1], None, [256, 256], [0.0, 255.0, 0.0, 255.0])
x.append(((hist / 255).flatten()))
y.append(self.label[i])
x = np.array(x)
y = np.array(y)
return x,y 数据预处理,生成数据与标签,即特征向量X,特征值Y,数据集包含1000张图片,文件名称格式为‘xxx.jpg’,每一类为连续的100张,通过OpenCV读入图片数据,再取[0],[1]通道的色彩直方图,经过归一化最后展平为特征向量 $X_i$,与标签$Y_i$对应。
2.2 将数据划分为训练集与测试集
数据按照7:3划分为训练集与测试集,得到X_train, X_test, y_train, y_test
X_train, X_test, y_train, y_test = train_test_split(X, Y, test_size=0.3, random_state=1)
#700张训练集300张测试集
2.3 分别调用四个算法的库函数训练,并获取预测结果
调用各个算法的库函数训练,并获取预测结果,测试集标签,训练预测的时间损耗
2.3.1 Bayes
sklearn共有5中Bayes算法,经过对比,使用多项式朴素贝叶斯分类器适来分类具有离散特征的数据会获得更好的效果。
#https://scikit-learn.org/stable/modules/generated/sklearn.naive_bayes.GaussianNB.html#sklearn.naive_bayes.GaussianNB
def clf_byss():
    time1 = datetime.datetime.now()
    clf_bysp = MultinomialNB()
    clf_bys = clf_bysp.fit(X_train,y_train)
    predict_labels = clf_bys.predict(X_test)
    time2 = datetime.datetime.now()
    return predict_labels, y_test, time2-time1
2.3.2 SVM
将使用的内核类型设置为‘linear’,要比‘poly’,‘rbf’的准确率高
#https://scikit-learn.org/stable/modules/generated/sklearn.svm.SVC.html#sklearn.svm.SVC
def clf_svms():
    time1 = datetime.datetime.now()
    clf_svmp = svm.SVC(kernel='linear', C=0.01)
    clf_svm = clf_svmp.fit(X_train,y_train)
    predict_labels = clf_svm.predict(X_test)
    time2 = datetime.datetime.now()
    return predict_labels, y_test, time2-time1
2.3.3 Decision-Tree
将最大深度在10以下时准确率会随深度的增加而提高,但再提高深度准确率不再有明显提升,因此在此实验中将最大深度设置为10较为合适。
#https://scikit-learn.org/stable/modules/generated/sklearn.tree.DecisionTreeClassifier.html?highlight=decisiontree#sklearn.tree.DecisionTreeClassifier
def clf_dtrees():
    time1 = datetime.datetime.now()
    clf_dtreep = tree.DecisionTreeClassifier(max_depth=20)
    clf_dtree = clf_dtreep.fit(X_train,y_train)
    predict_labels = clf_dtree.predict(X_test)
    time2 = datetime.datetime.now()
    return predict_labels, y_test, time2-time1
2.3.4 K-Means
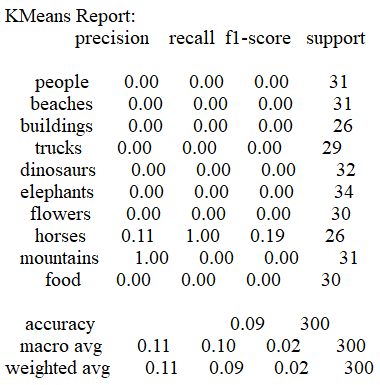
K-Means算法需要重新标定数据,在测试过程中无论是将整个数据集放入训练还是不打乱数据集都无法获得较好的收敛效果,原因可能是KMeans算法的初始点较为随机且数据的特征较为集中,不能有很好的预测结果,具体原因还待查证
#https://scikit-learn.org/stable/modules/generated/sklearn.cluster.KMeans.html?highlight=kmeans#sklearn.cluster.KMeans
def clf_kms():
    Xk,Yk = dl.DataLoader(path, labels, relabel='true').data()
    X_train, X_test, y_train, y_test = train_test_split(X, Y, test_size=0.3, random_state=1)
    time1 = datetime.datetime.now()
    clf_kmp = KMeans(n_clusters=10,max_iter=300)
    clf_km = clf_kmp.fit(X, Y)
    predict_labels = clf_km.predict(X_test)
    time2 = datetime.datetime.now()
    return  predict_labels, yk_test, time2-time1
2.4 测试结果输出
实验数据处理与输出,训练完后获取测试结果,与真实标签对比获取混淆矩阵,对混淆矩阵归一化处理并可视化,sklearn中有封装好的对混淆矩阵可视化的库,但使用seaborn中的热点图(heatmap)可以对混淆矩阵进行更多的个性化设计
titles_options = [("Confusionmatrix_Bayes", clf_byss()),
                  ('Confusionmatrix_SVM', clf_svms()),
                  ('Confusionmatrix_Decision-Tree', clf_dtrees()),
                  ('Confusionmatrix_KMeans', clf_kms())]
for title, result in titles_options:
    predict_labels, y_test, cost = result[0], result[1], result[2]
    con_mat = confusion_matrix(y_test, predict_labels)  #混淆矩阵
    con_mat_norm = con_mat.astype('float') / con_mat.sum(axis=1)[:, np.newaxis]  # 归一化
    con_mat_norm = np.around(con_mat_norm, decimals=2)
		#测试报告
    reports = classification_report(y_test, predict_labels, target_names=labels, zero_division=1)
		accuracy_scores = accuracy_score(y_test, predict_labels)
    #https: // seaborn.pydata.org / generated / seaborn.heatmap.html
    plt.figure(figsize=(12, 12), dpi=120)#可视化
plt.text(11,-1, 'Acc: {:.2f}'.format(accuracy_scores), fontdict={'fontsize': 15,'fontweight' : 1000})
    ax = sn.heatmap(con_mat_norm, annot=True, xticklabels=labels,yticklabels=labels,cmap=plt.cm.Blues )
    ax.set_title(title, fontdict={'fontsize': 20,'fontweight' : 1000})  # 标题
    ax.set_xlabel('Predict Label', fontdict={'fontsize': 15,'fontweight' : 1000})  # x轴
    ax.set_ylabel('True Label', fontdict={'fontsize': 15,'fontweight' : 1000})  # y轴
    #结果存储
    with open('./result/OutputsH.txt','a') as f:
        f.write('{} Report:\n{}\nCost:\n{}\n\n\n'.format(title[16::], reports, cost))
    # print('{} Report:\n{}\n\tCost:\n\t{}\n\n'.format(title[16::], reports, cost))
    plt.savefig('./result/{}.jpg'.format(title[16::],time))
f.close()
3 实验结果
实验时间:2021-03-13 13:44:13.792523
实验配置:CPU IntelI5-8300H
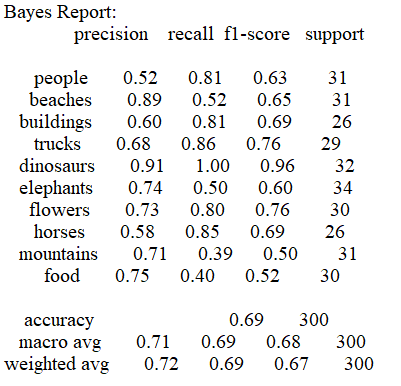
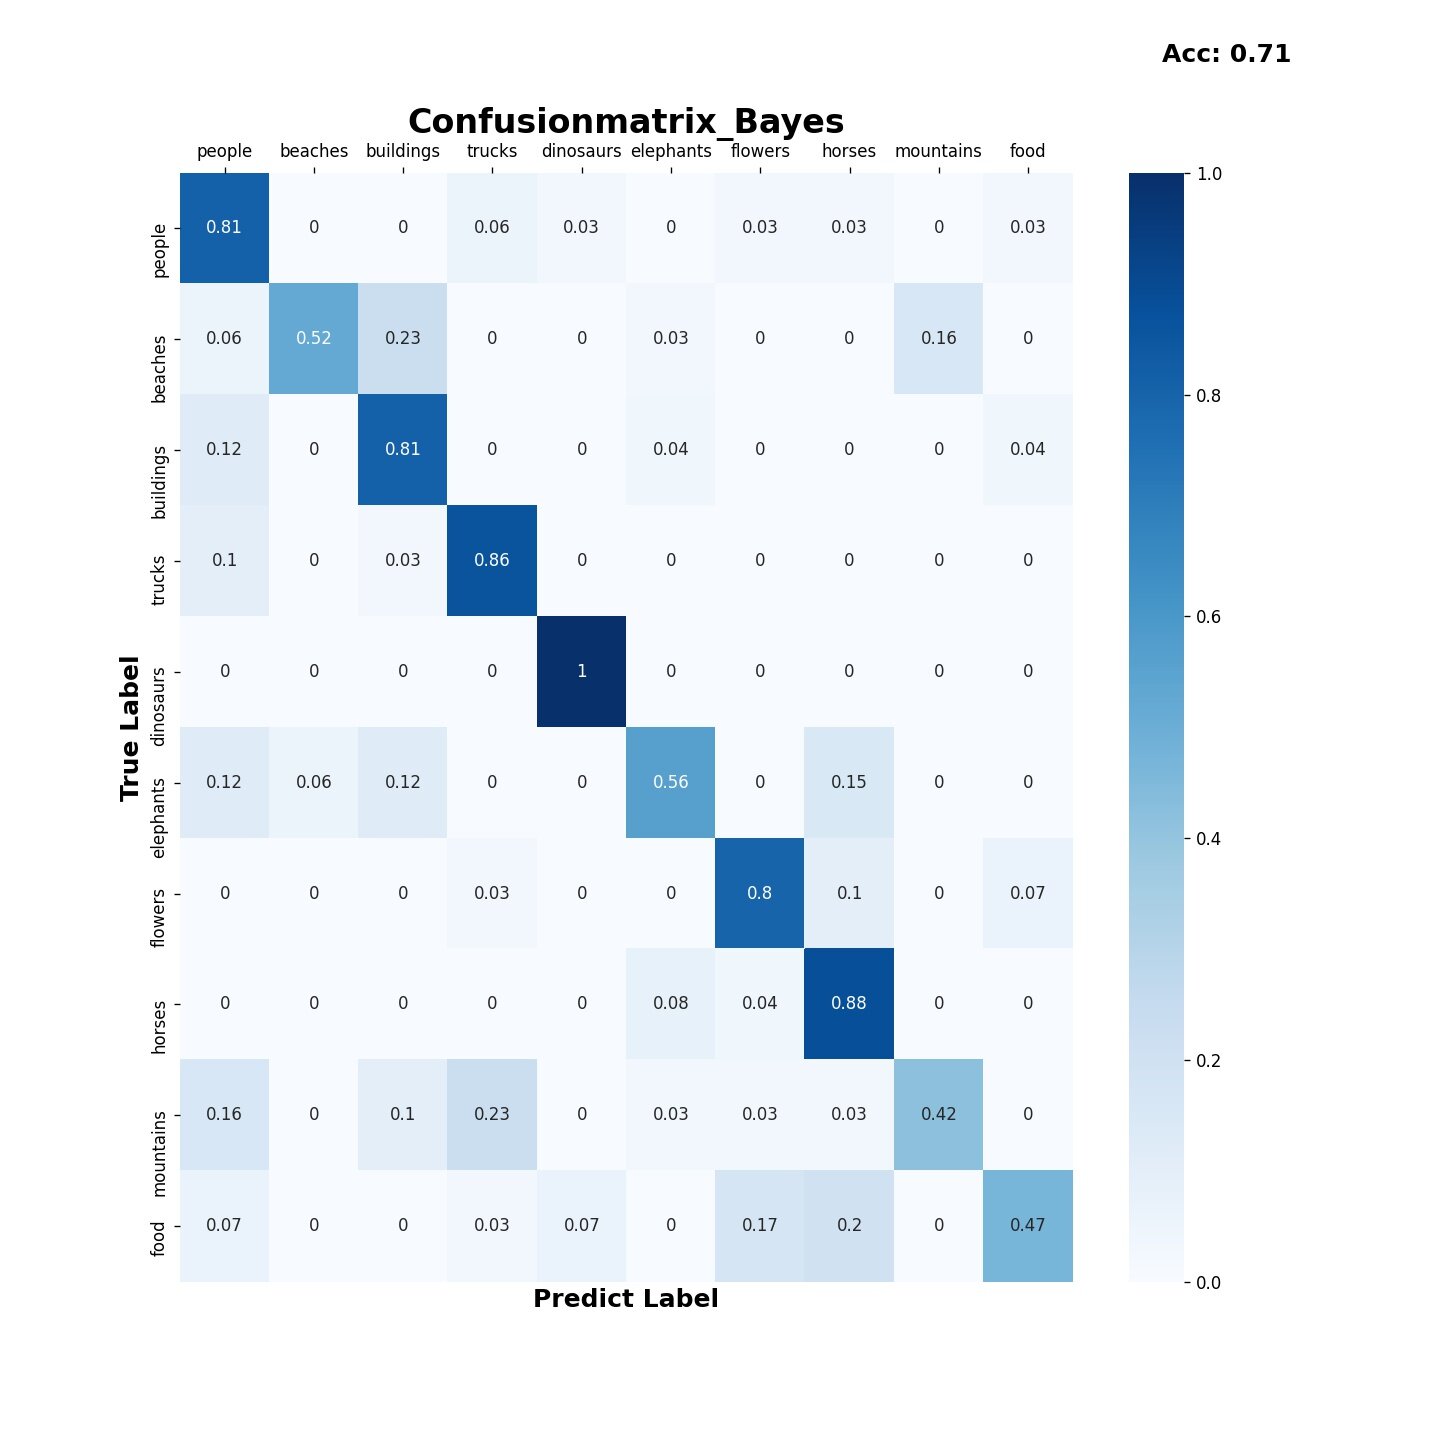
3.1 Bayes 算法
-
准确率:
-
时间损耗: 0:00:00.312369
-
混淆矩阵
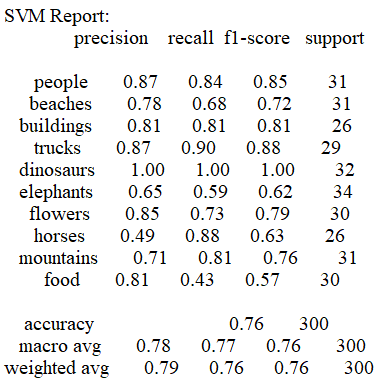
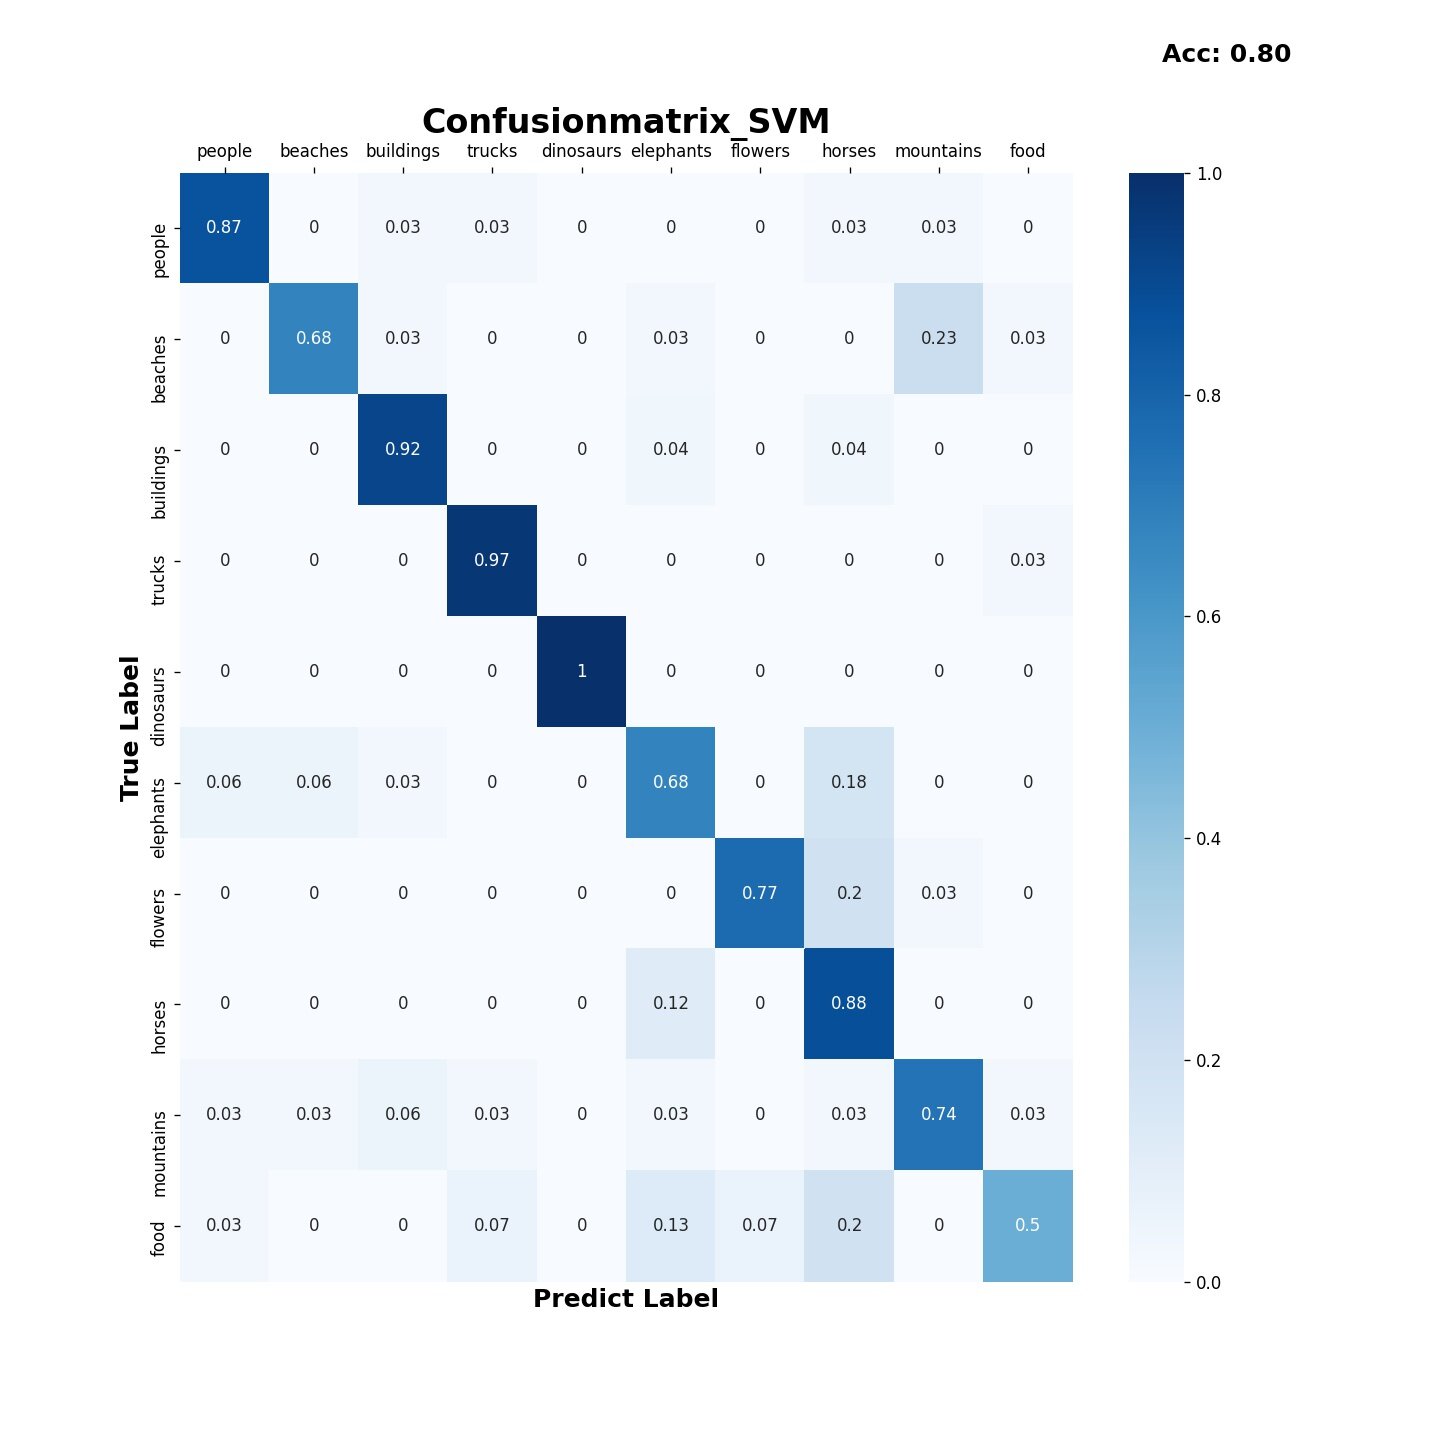
3.2 SVM算法
-
准确率
-
时间损耗: 0:00:12.992398
-
混淆矩阵
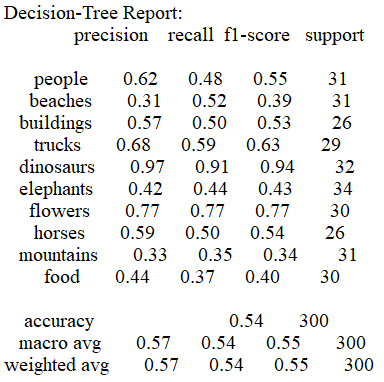
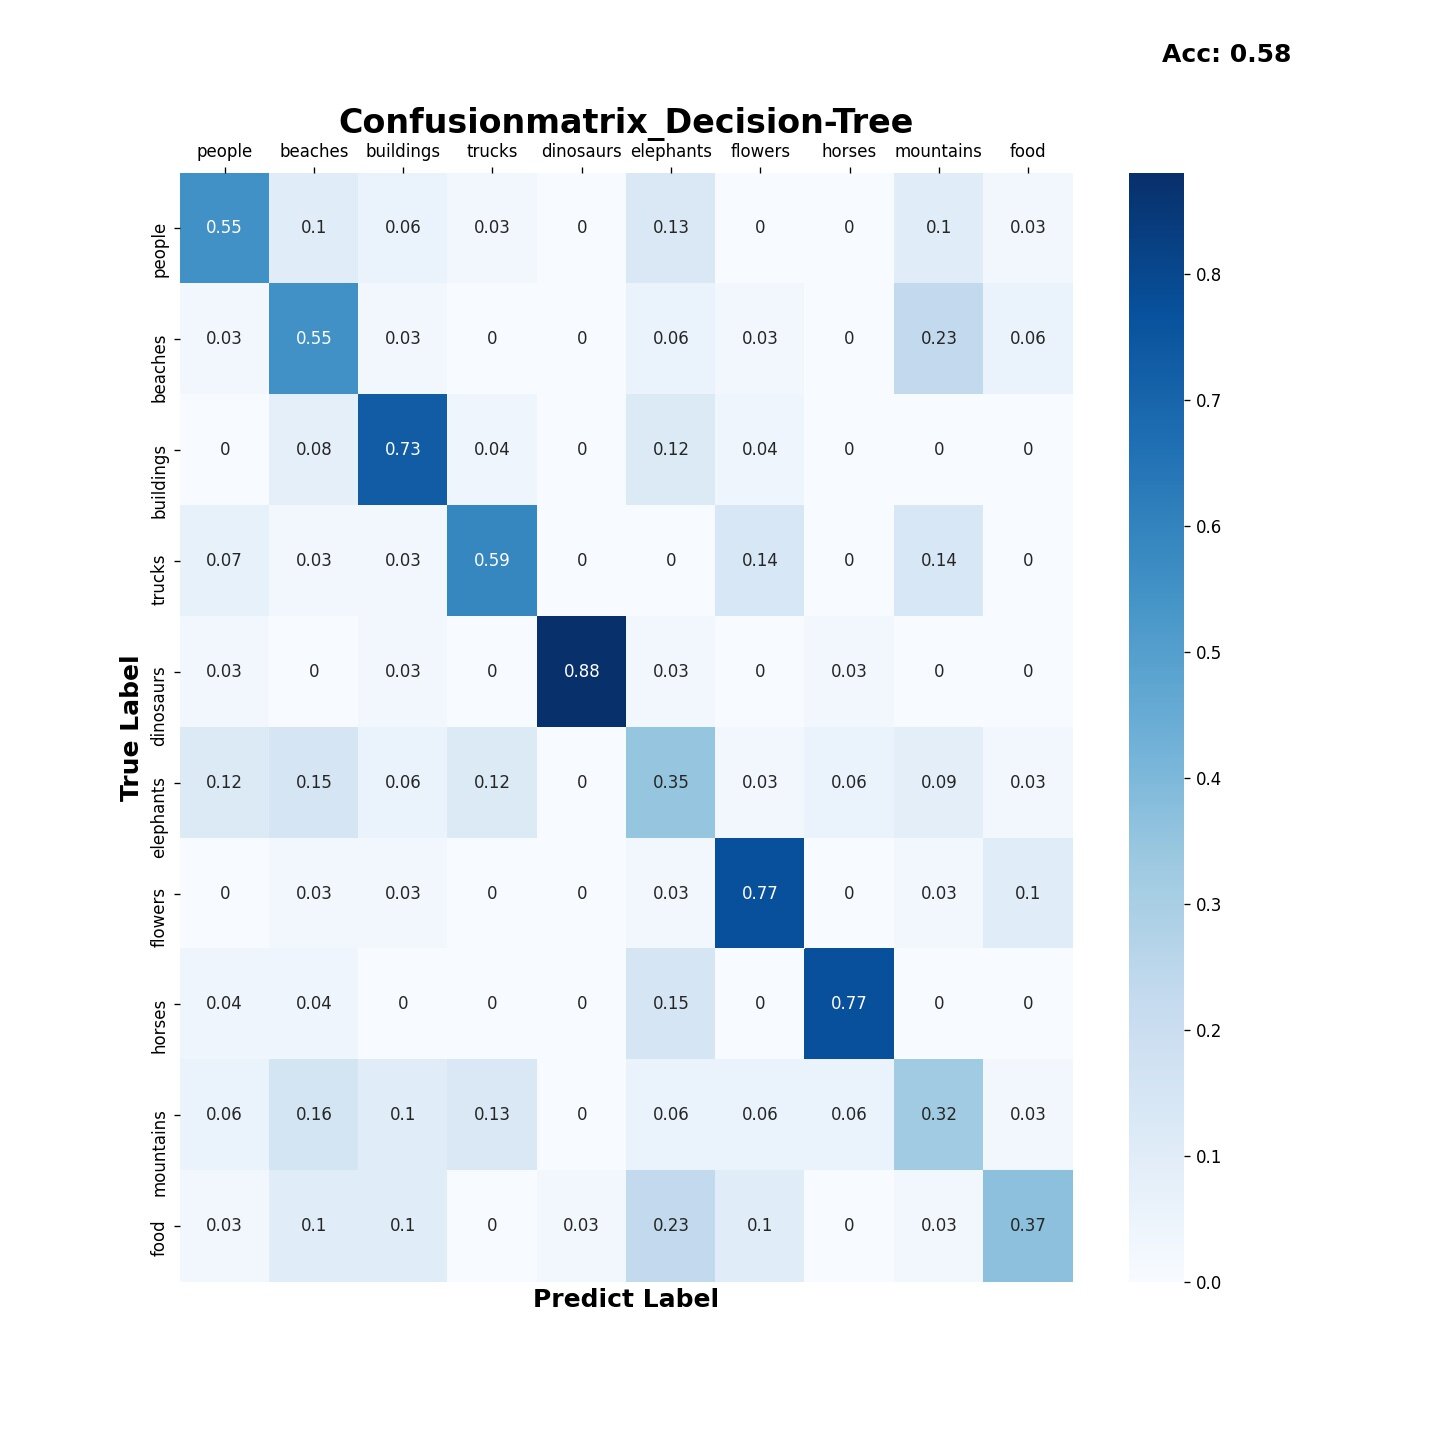
3.3 Decision-Tree算法
-
准确率
-
时间损耗: 0:00:06.349969
-
混淆矩阵
3.4 K-Means算法
-
准确率
-
时间损耗: 0:00:13.707495
-
混淆矩阵
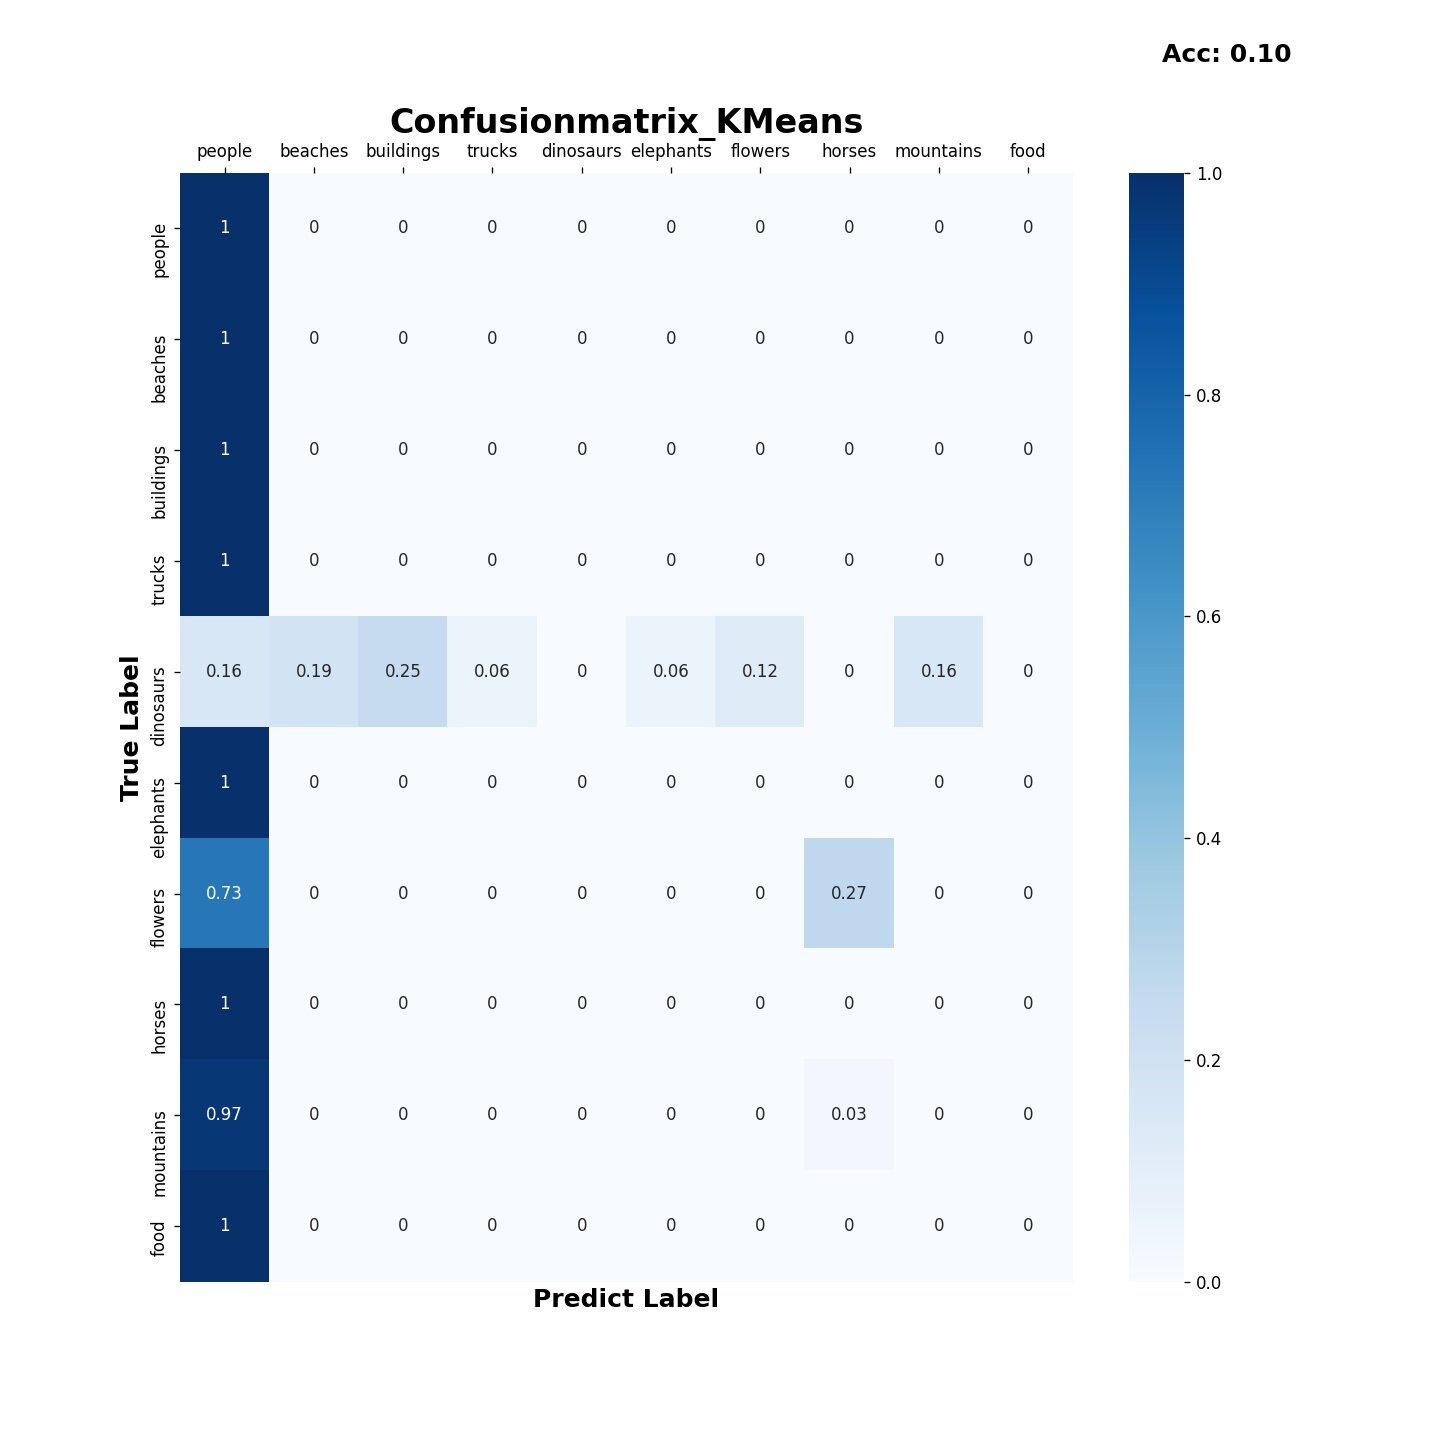
4 结果分析
实验过程中将图片统一尺寸的结果比不统一尺寸后的结果准确率要低,而时间损耗持平,可能是统一尺寸后使数据损失了部分特征,因此最后的实验不做统一尺寸的操作。
结果表明Bayes,SVM算法在分类该数据集时综合性能优于决策树和KMeans算法,Bayes算法的时间损耗为0.248,要优于SVM算法的16.321;但SVM算法的准确率为0.80,比Bayes的0.71表现得更好。决策树算法的时间损耗为6.477,准确率为0.58效果较差,而KMeans算法由于受初始点的选取的影响,结果预测普遍趋向于某一类,在尝试更改初始点选取策略,特征向量提取的方式以及训练是否打乱后都无法有效的提高分类效果。在实际运用中如果有着较高的精度要求建议使用SVM算法,如果需要考虑更多的时间效率,建议使用Bayes算法。
- 参考资料
OpenCV文档: http://www.opencv.org.cn/opencvdoc/2.3.2/html/index.html
Sklearn文档:https://scikit-learn.org/stable/modules/
Matplotlib文档:https://matplotlib.org/stable/gallery/index.html
Seaborn文档:https://seaborn.pydata.org/generated/seaborn.heatmap.html